
|
| Greatest Hits |

|
June 18 - 21 2015 -- Fun in the Sun
|
View a movie of the coronal structure images from GOES-15 SXI June 18-21 2015:
webm
|
|
|
July 1 - 14, 2012 -- Thowing Sparks
|
View a 14 day SXI movie that includes this spectacular event, subsampled every four images for this exposure sequence:
webm
,
mp4
, wmv
View a 03 day SXI movie that includes all images taken with this exposure sequence:
webm,
mp4,
wmv
Sun enthusiast Kai Sävke and his friend Ruth created this movie from the NGDC SXI archive, enjoy it on YouTube.
|
|
|
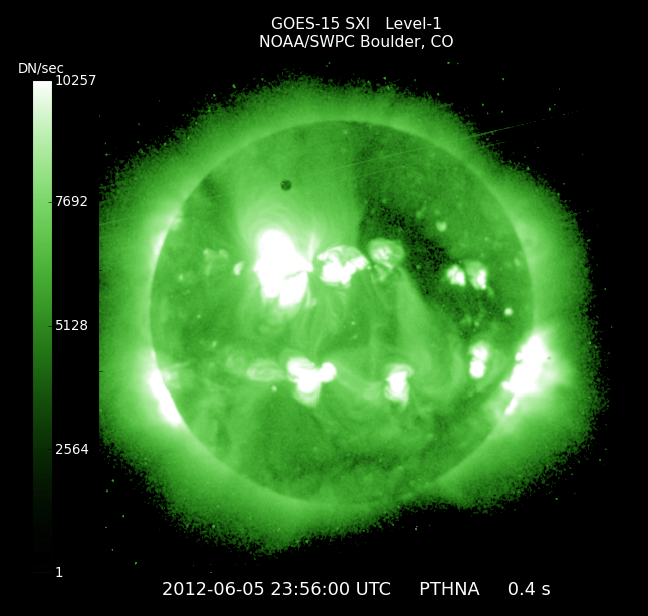
June 5, 2012 -- Transit of Venus
|
The transit of Venus officially began at 2012-06-05 22:09 UTC and ended at 2012-06-06 04:49 UTC.
The view from GOES-15 SXI is unique in that it shows Venus passing in front of the Solar Corona, making the transit nearly 2 hours longer.
View a two day SXI movie that includes the transit:
webm
,
mp4,
mpg
NOAA Visualizations Lab also generated an SXI video, see it on
YouTube.
See other images of the Venus transit taken around the world in this
Wikipedia article
. |
|
|
March 21, 2012 -- Extreme Space Weather Events

|
Will we ever again witness the violence in space weather that occurred in 1989?
Unsure what that means? This collection of plots will help.
| Cycle 22 Began Sep 1986 |
| March 1989 |
pdf
|
|
| September 1989 |
pdf
|
|
| October 1989 |
pdf
|
|
| March 1991 |
pdf
|
|
| June 1991 |
pdf
|
|
| Cycle 23 Began May 1996 |
| July 2000 |
pdf
|
|
| November 2001 |
pdf
|
|
| October 2003 |
pdf
|
|
| January 2005 |
pdf
|
|
| September 2005 |
pdf
|
|
| December 2006 |
pdf
|
|
| Cycle 24 Began Jan 2008 |
| March 2012 |
pdf
|
|
| Cycle 24 Max April 2014 |
Compare the August 1972 event (
pdf
) to the October 1989 event (
pdf
) using Cosmic Ray observations only.
Read more about the August 1972 event in UAG-28:
-
part I
: Summaries, Solar Optical Data, Solar Radio Data.
-
part II
: Space Observations, Cosmic Rays, Ionosphere
-
part III
: Ionosphere (cont), Geomagnetism, Aeronomy and Miscellaneous.
Overview_19830101-00h_20141231-24h.png
A similar
plot
, displaying the latest 14 days, is updated hourly. It may be a long wait for the next big event, but don't be caught bare headed!
Note #1: Energetic ions that penetrate Earth's electromagnetic and atmospheric defenses typically have enough energy remaining to then continue miles into solid rock.
Note #2: Small circles on the plot time-scale indicate when the satellite/station is at local noon (open) or midnight (filled).
References:
Solar Flares
Coronal Mass Ejections
Solar Proton Events
http://cr0.izmiran.rssi.ru -- source of all ground based station data used above.
Galactic Cosmic Rays
Ground Level Events
Forbush Decreases and galactic influences on our weather?1 2
Access and plot data from historic Cosmic Ray Events
Particle Event List
NPR March 15, 2012: Raging Sun Storms In Our Minds.
See how artists interpret what scientists say:
The scientists are Janet Luhman (who goes first), Bill Abbett, David Brain and Stephan Mende. |
|
|
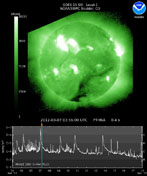
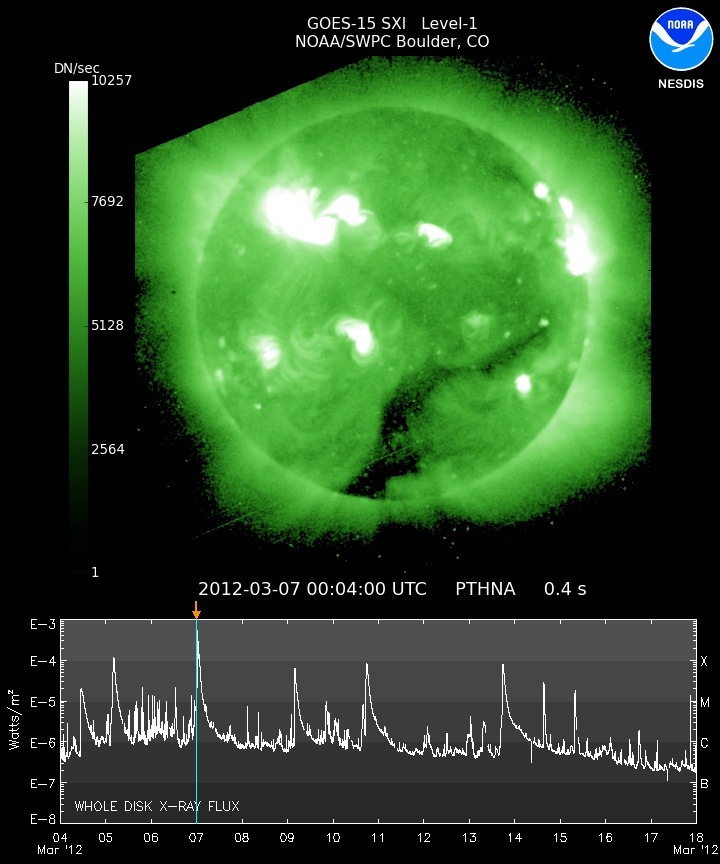
March 4-17, 2012 -- Flares and Such
|
View a
stack plot
of the space environment March 4 - 17, 2012 or see the big picture in a
108-day plot
covering Januray 1, 2012 to April 17, 2012.
Cosmic ray data in these plots from Moscow station show a drop in levels (Forbush Decrease) caused by the passage of a CME.
POES radiation maps -- due to a ground processing outage these data are not available February 29, 2012 - March 8, 2012.
The plots below are three-day, 2º bin, sliding means that combine data from the entire 6-satellite constellation:
View a movie of SXI images March 4 - 17, 2012 in the format of your choice:
webm
,
mp4
,
mpg
.
The cadence of SXI movies can be affected by changes in the SXI exposure sequence that take place when an event is in progress.
Lockheed Martin Solar and Astrophysics Laboratory (LMSAL) provides an events page containing a plethora of details, March 4-10, 2012.
|
|
|
June 30, 2011 -- New SXI Movie Products
|
|
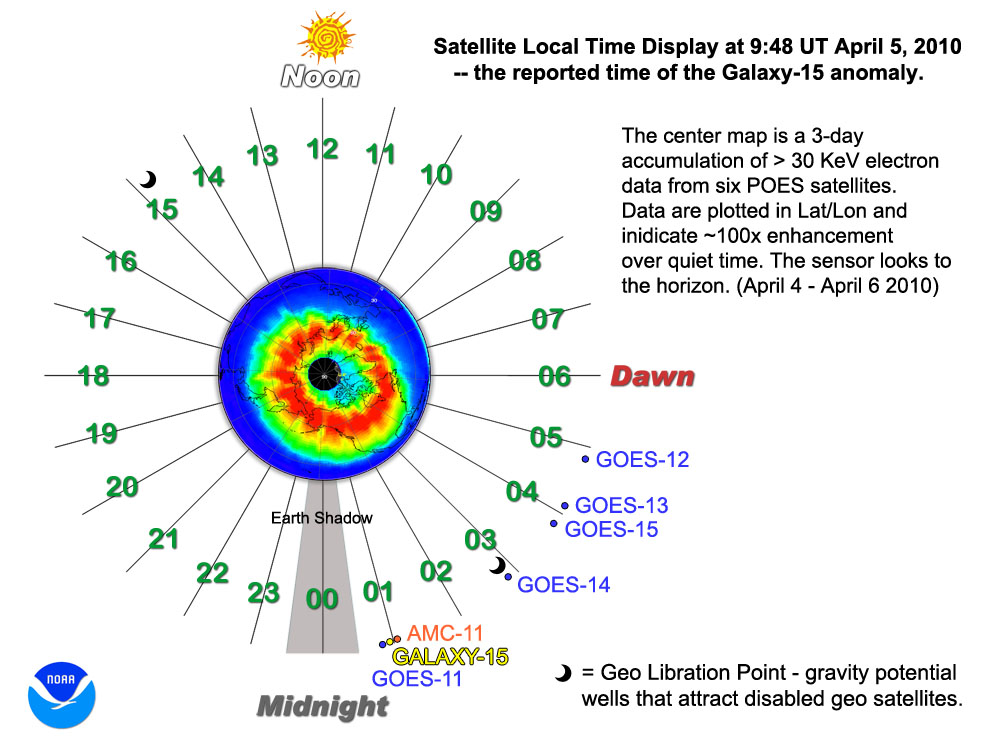
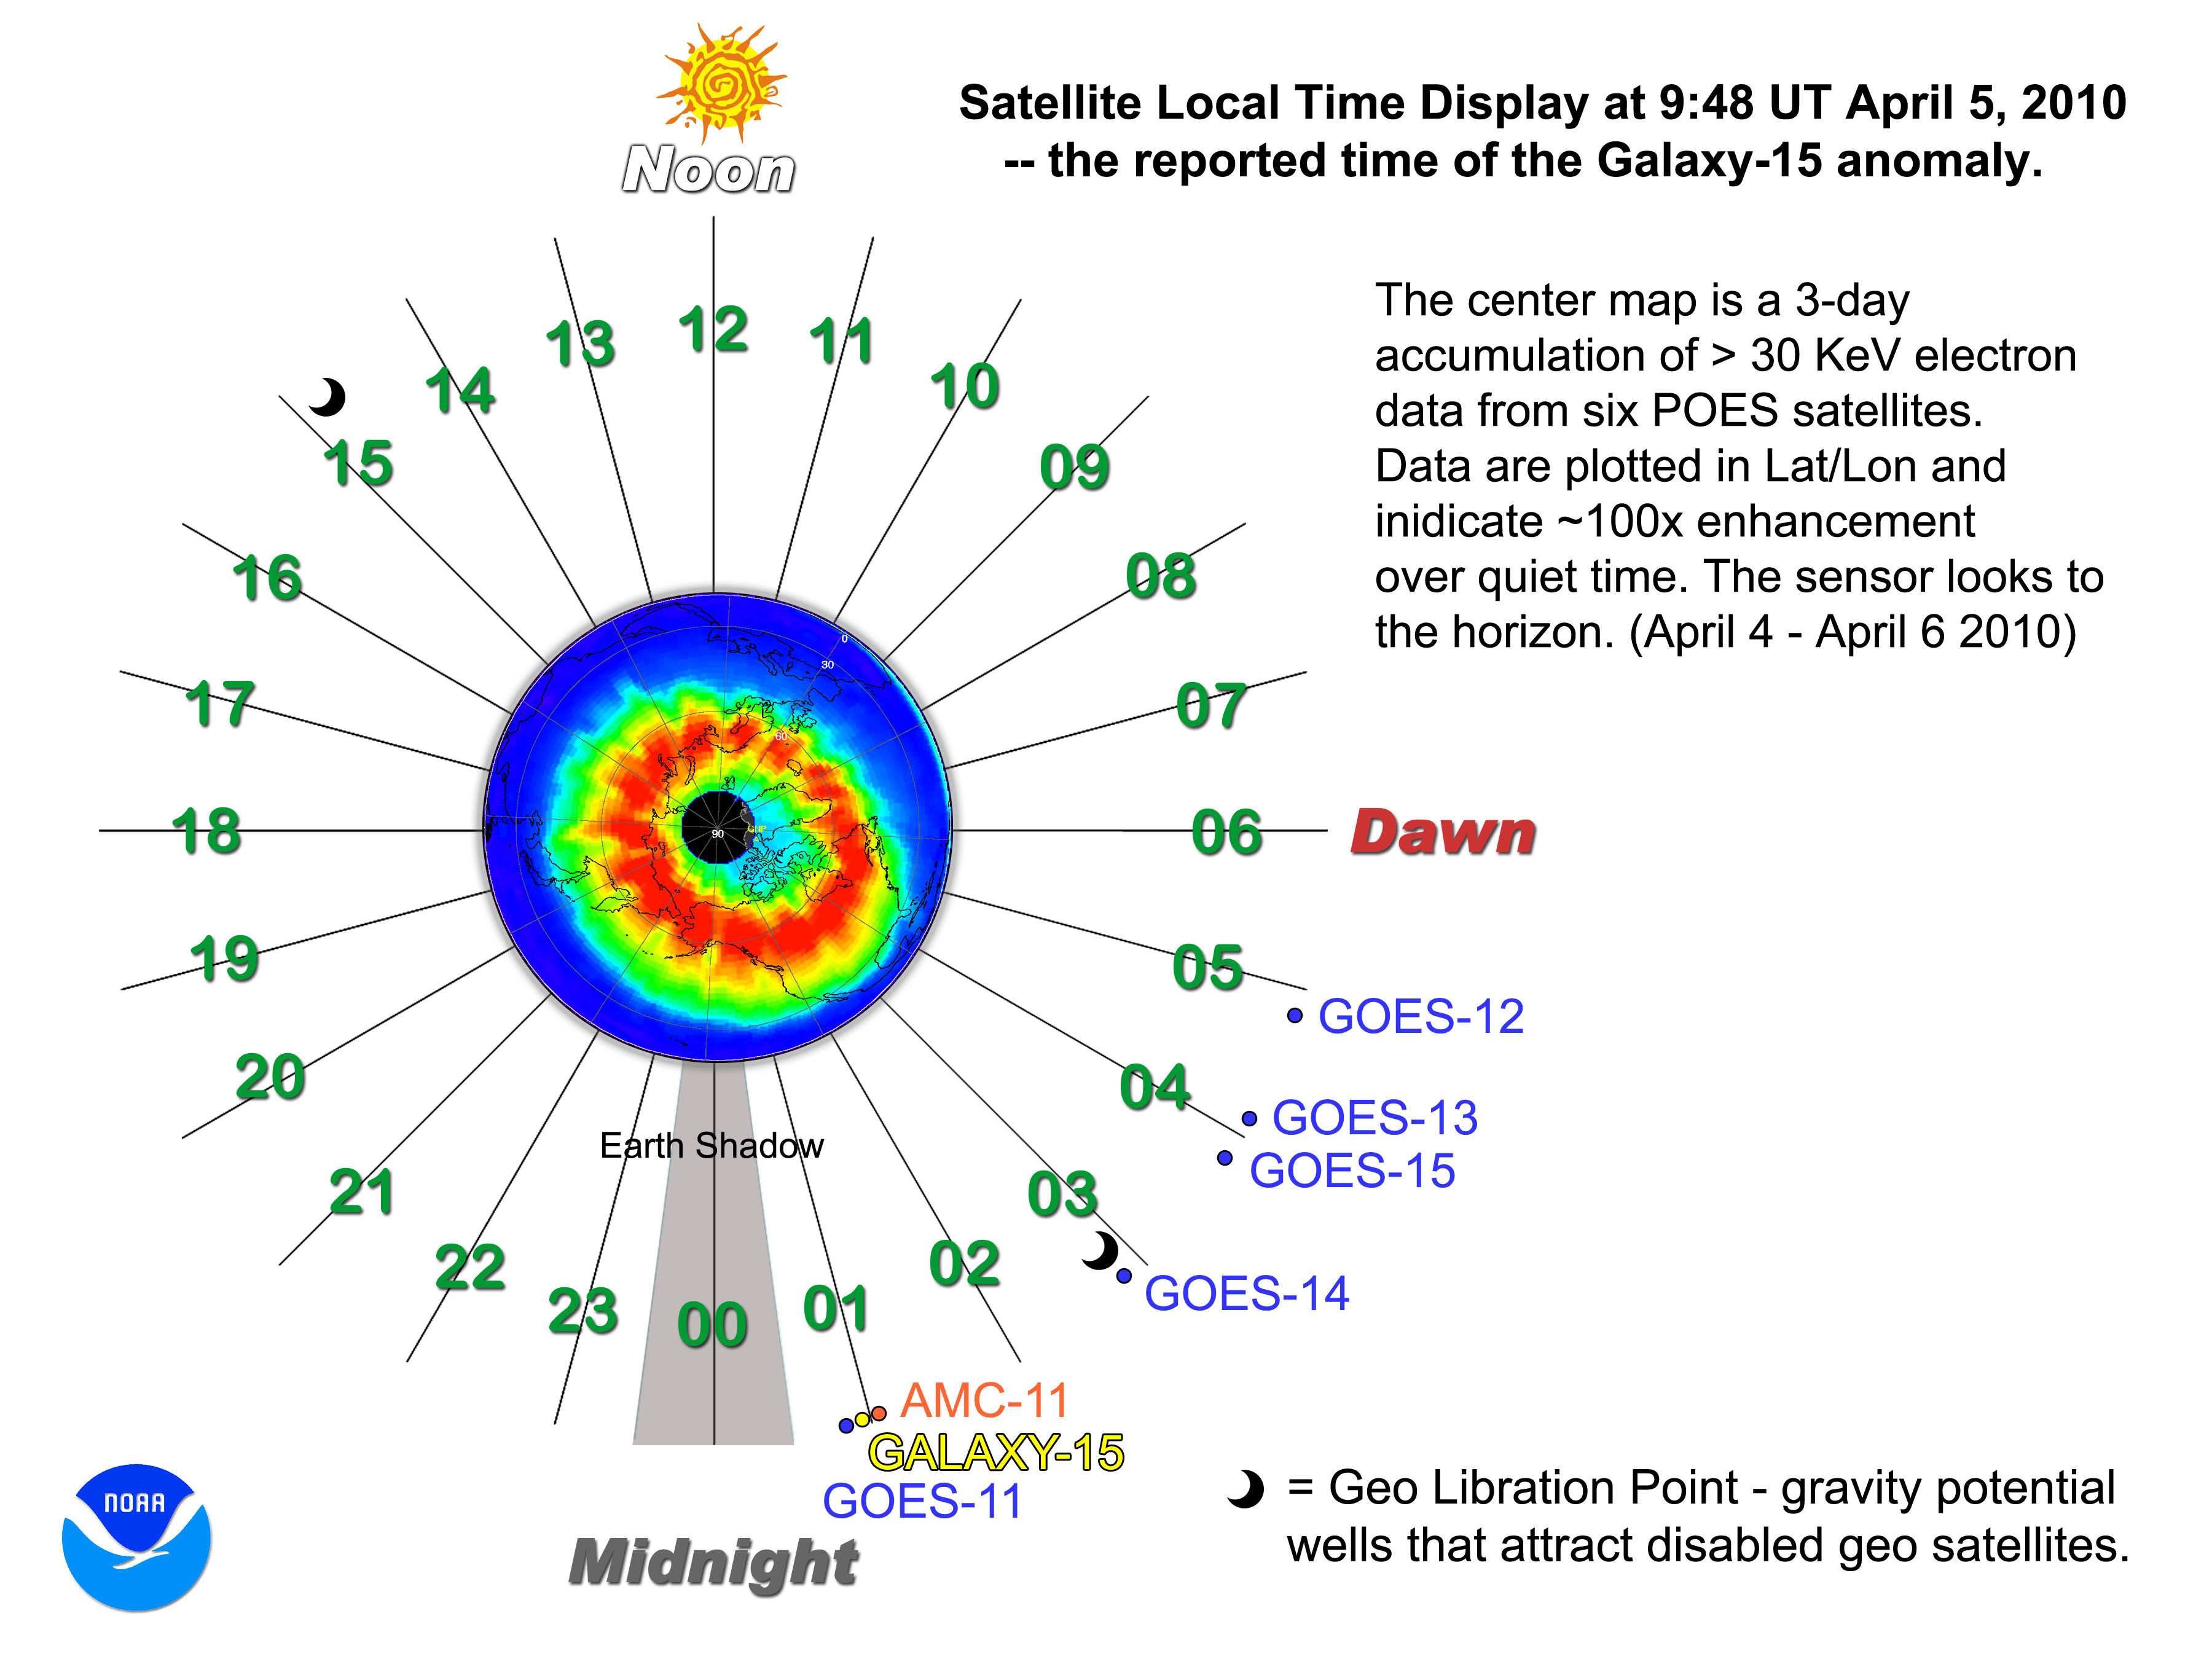
April 5, 2010 0948 UT Galaxy-15 Anomaly -- root cause of the anomaly was not identified by the operator.
|
The failure time used in these plots is the time when Intelsat noticed that Galaxy-15 was not responding to commands, since commands can be weeks apart it is uncertain when the failure actually occured, see Galaxy-15 wiki page.
April 3, 2010 GOES-13 SXI Flare Sequence: 20100405_Galaxy15_SXI_10fps.mpg
April 3, 2010 GOES-13 SXI Flare Sequence combined with whole disk X-rays from XRS: 20100405_Galaxy15_SXI_XRS.mpg
April 3-5, 2010 GOES-11 SEM summary plot: g11_g14_custom_re_galaxy-15_20100403-00h_20100405-24h.pdf
April 3-5, 2010 GOES-14 SEM summary plot: g14_custom_re_galaxy-15_20100403-00h_20100405-24h.pdf (Millions of vectors, quicker display via this JPEG)
March 28 - April 15, GOES-14 SEM summary plot: g14_custom_re_galaxy-15_20100328-00h_20100415-24h.pdf
April 1, 2010 - April 30, 2010 POES >30 KeV global radiation map movie orthographic north: poes_201004_mep90e1_orthographic-north_6fps.mpg (source images .zip)
April 1, 2010 - April 30, 2010 POES >30 KeV global radiation map movie cylindrical: poes_201004_mep90e1_cylindrical_6fps.mpg (source images .zip)
April 5, 2010 0948 satellite local time for Galaxy-15 and GOES fleet: SLT_chart_galaxy15.jpg (full size)
Quicktime no longer supports MPEG video very well, if QT is your browser's default video player download the movies and watch them with something else like Windows Media Player or VLC media player.
|
|
|
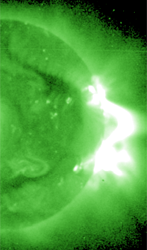
December 2006 Flare Activity
|
An exceptionally active solar region (930) rotated onto the solar disk at a time when solar cycle 23 was theoretically approaching minimum levels.
On December 5th 2006 at 10:18 UT region 930 generated an X9 flare that can be seen in both the sequence of GOES-13 SXI images (pdf) and in the
plot of GOES Space Environment Monitor data
.
Region 930 continued to generate flares over the ensuing two weeks and resultant ion storms were also recorded by GOES. One such storm had sufficient energy to be recorded at ground level by neutron monitoring stations.
GOES 13 SXI sustained damage to several pixels of its detector while observing this X9 flare event. The source of the damage was the large X-ray flux of the flare convolved with the observing sequence. At the time, the susceptibility of the detector to radiation damage was not well understood or constrained. The type of damage affects 8 lines of pixels across the CCD and is unlikely to recover. Operational constraints and updates to on-board observing sequence software will enable the SXI to continue its mission without further damage to its detector. The impact on observations and prediction is currently being assessed as the new sequence software and operational constraints are developed. In addition, ground algorithms will be developed to minimize the appearance of the 'lost' lines through interpolation or other means.
Read about other impacts of this flare:
SpaceFlightNow.com
Solar Flares Ate My GPS
For further information contact Dr. Steven Hill (Steven.Hill@noaa.gov) with NOAA's Space Weather Prediction Center.
|
|
|
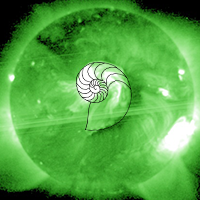
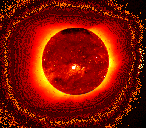
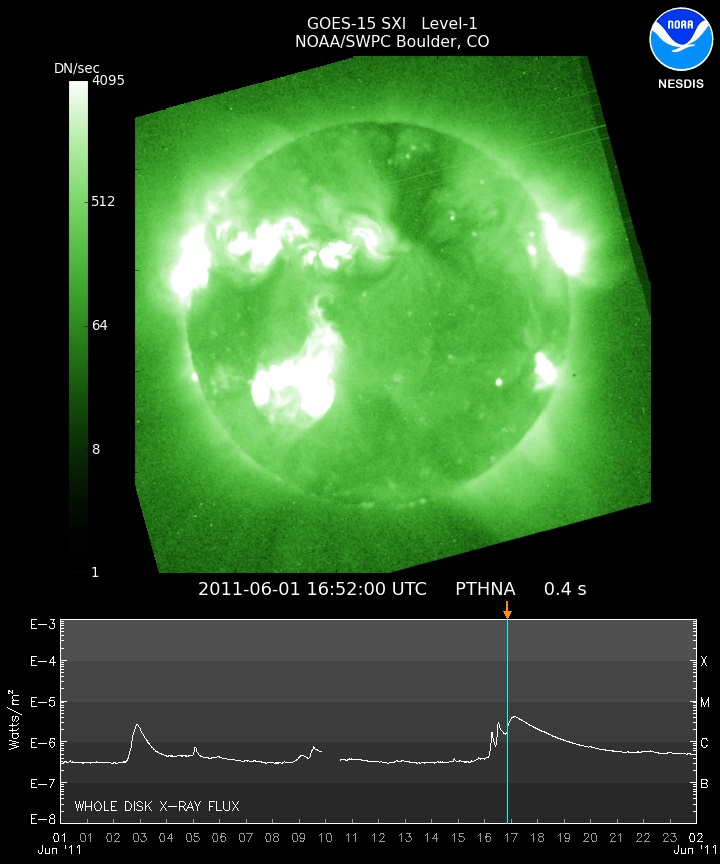
GOES-13 Deep Coronal Images
|
The GOES-13 SXI is substantially more sensitive than the GOES-12 instrument and has much less internal light scattering. This allows for very 'deep' or long exposures of the Sun's outer atmosphere known as the Corona. Collecting these images requires intervention by NOAA’s Satellite Operations Control Center since the special pointing is done by maneuvering the entire GOES-13 platform. The Coronal portion of the images is a mosaic of four individual 8-second exposures taken over a 30 minute span.
The dramatic version on the left was generated at NGDC using a non-linear color table to enhance faint detail.
P_thin_ext_cor.png (The version of this image to the left has been stylized using a non-linear color table.)
PTHNWIDE.png
PTHNWIDE_WaveletsGamma.png
PTHNWIDE_WaveletsGamma_LVGamp16Contp8.png
PTHNWIDE_WaveletsGamma_LVGamp16Contp8Cropped.png
For further information contact Dr. Vic Pizzo (Vic.Pizzo@noaa.gov) with NOAA's Space Weather Prediction Center.
|
|
|
GOES-13 SXI First Light
|
The first image from the GOES-13 SXI was taken July
6, 2006 15:11:18 UTC. |
|
|
GOES-13 SXI/XRS Movie Prototype
|
|
SXI Kiosk Movie
 |
This movie contains images and footage of GOES-12 and SXI
from launch to operations. It has been shown at the NOAA booth
at many conferences.
SXI_KIOSK_V1.MPG
(104 MB MPEG-2, 2 min 30 sec.)
Note, if you save an MPEG-2 file to disk, your browser may
try to add a .mp3 extension. |
|
|
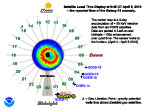
January 2005 -- Martin Luther King
Storm
 |
Solar active region 0720 rotated onto the east limb on January
10th and put on a pyrotechnic display uncharacteristic for
this phase of the solar
cycle before disappearing beyond the west limb on January
23rd. On January 15th this region released the first of five
X-class solar flares. The last of those flares, January 20th,
was associated with an extraordinary ion storm whose effect
reached Earth's surface.
The movies below perfectly illustrate the cause-and-effect
relationship between intense solar activity and satellite
disruptions. The flares on January 17th and 20th are closely
followed by noise in the SXI telescope resulting from energetic
ions penetrating SXI. Ions with sufficient energy and atomic
number can penetrate satellite components and deposit charge
along their path. Sufficient charge deposition can introduce
erroneous information into solid state memory devices. The
common term for this is Single Event Upset (SEU), and the
classic example of their occurrence comes from the operational
history of TDRS-1.
An overview plot of this solar storm can be seen in a specially
prepared
GOES Space Environment Monitor plot
.
GLEs are enhancements in ground based neutron monitor counts
that occur when solar ions with sufficient energy (>400
MeV/nucleon), strike the upper atmosphere and initiate a nuclear
cascade that reaches Earth's surface.
X-rays from the January 20th X7.1 flare began to arrive at
0636 UT, enhanced energetic ion levels began at 0650 UT. Therefore,
the fastest ions traveled the Earth-Sun distance (150 million
km or 93 million miles) in approximately 22 minutes, indicating
a speed approximately 40% that of light.
Mo Dy Begin Max End Reg# Lat CMD X-class
Jan 15 0022 0043 0102 0720 N14 E08 X 1.2 Ion Storm
Jan 15 1947 2007 2028 0720 N15 W05 X 2.6 Ion Storm
Jan 17 0659 0952 1007 0720 N15 W25 X 3.8 Ion Storm
Jan 19 0803 0822 0840 0720 N15 W51 X 1.3 Ion Storm
Jan 20 0227 0636 0701 0726 N14 W61 X 7.1 Ion Storm, Ground Level Enhancement
SXI_20050114_000000_BB_G12_AR2_08D.MPG
(13 MB MPEG-1, 27 sec.)
SXI_20050114_000000_BB_G12_AR2_08D.MP2 (13 MB MPEG-2, 27 sec.)
SXI_20050114_000000_BB_G12_AR2_08D_JPG.ZIP
(52.9 MB zip archive of 803 JPEG source images)
This high cadence sequence covers only January 20th. These
X-ray images show both the eruption of the flare and the resultant
relativistic ions smashing into SXI & GOES-12 like bugs
on a windshield.
SXI_20050120_000000_BB_G12_AR2_01D.MPG
(11 MB MPEG-1,
23 sec.)
SXI_20050120_000000_BB_G12_AR2_01D.MP2
(11 MB MPEG-2, 23 sec.)
SXI_20050120_000000_BB_G12_AR2_01D_JPG.ZIP
(45 MB zip archive of 703 JPEG source images)
Note, if you save an MPEG-2 file to disk, your browser may
try to add a .mp3 extension. |
|
|
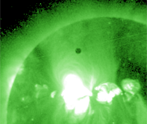
June 8, 2004 -- Venus Transits the Solar Disk
|
This transit of Venus is the first in 122 years. In SXI images,
Venus appears as a dark disk about 1/30th the Sun’s
apparent diameter. Since the Sun’s corona extends well
above the disk, Venus was visible in silhouette for approximately
9 hours, versus the 6 hours seen from Earth. The path across
the disk is from the southeast to the southwest.
These movies were created from a special image set generated
by NOAA's Space Weather Prediction Center.
SXI_SPECIAL_20040608_VENUS_09H.MPG
(1.9 MB MPEG-1, 0.7 sec.)
SXI_SPECIAL_20040608_VENUS_09H.MP2 (3.8 MB MPEG-2, 0.7 sec.)
SXI_SPECIAL_20040608_VENUS_09H_JPG.ZIP
(53.4 MB zip archive of JPEG source images)
Note, if you save an MPEG-2 file, your browser may try to
rename it with a .mp3 extension. |
|
|
The Great Halloween Solar Storm of 2003

|
A series of solar active regions unleashed an extraordinary
display of solar activity in October and November of 2003.
These solar storms disrupted airline communications and GPS and disabled the ADEOS-II satellite. GOES X-ray sensors saturated at X17 during the November 4th flare but estimates of the actual peak range from X28 to X45 which made this the largest flare ever recorded.
You can view the affects in the near-Space Environment in
plots of the GOES Space Environment Monitor data
. These plots show the series of significant
flare events from October 19th through November 5th which
included 17 flares of class M5 or above, 11 of these were
X-class flares.
Mo Dy Begin Max End Reg# Lat CMD X-class
Oct 19 1629 1650 1704 0484 N08 E58 X 1.1
Oct 22 1947 2007 2028 0486 M 9.9
Oct 23 0819 0835 0849 0486 S21 E88 X 5.4
Oct 23 1950 2004 2014 0486 S17 E84 X 1.1
Oct 24 0227 0254 0314 0486 S19 E72 M 7.6
Oct 26 0557 0654 0733 0486 S15 E44 X 1.2
Oct 26 1721 1819 1921 0484 N02 W38 X 1.2 Ion Storm
Oct 26 2134 2140 2148 0484 M 7.6
Oct 27 0921 0927 0932 0486 S16 E26 M 5.0
Oct 27 1227 1243 1252 0486 S17 E25 M 6.7
Oct 28 0951 1110 1124 0486 S16 E08 X17.2 Ion Storm, Ground Level Enhancement
Oct 29 2037 2049 2101 0486 S15 W02 X10.0 Ion Storm, Ground Level Enhancement
Nov 02 1703 1725 1739 0486 S14 W56 X 8.3 Ion Storm, Ground Level Enhancement
Nov 03 0109 0130 0145 0488 N10 W83 X 2.7
Nov 03 0943 0955 1019 0488 N08 W77 X 3.9
Nov 04 1929 1953 2006 0486 S19 W83 X28.0 Ion Storm
Nov 05 1046 1052 1056 0486 S16 W90 M 5.3
The GOES-12 SXI was not operational during the first of these
large events, due to the ongoing diagnosis of a power system
anomaly. However, on October 28th SXI was reactivated at 1633
UT. The noise in the images at the beginning of this movie
are due to energetic particles from the October 28th and 29th
solar ion storms.
SXI_SPECIAL_20031028_163326_BB_G12_CS1_09D.MPG
(17.5 MB MPEG-1, 27 sec.)
SXI_SPECIAL_20031028_163326_BB_G12_CS1_09D.MP2
(13.2 MB MPEG-2, 27 sec.)
SXI_SPECIAL_20031028_163326_BB_G12_CS1_09D_JPG.ZIP
(58.9 MB zip archive of JPEG source images)
Movies made from POES energetic particle sensor data show how this sequence of solar storms affected Earth's radiation belts.
http://www.ngdc.noaa.gov/stp/satellite/poes/samplemovies.html
|
|
This movie uses a high cadence of images over a two day interval,
October 28-29, to highlight the exchange of solar material
between region #0486
(southern hemisphere) and region #0488 (northern hemisphere).
SXI_SPECIAL_20031028_163326_BB_G12_CS1_02D.MPG
(16.8MB MPEG-1, 15 sec.)
SXI_SPECIAL_20031028_163326_BB_G12_CS1_02D.MP2
(10.5MB MPEG-2, 15 sec.)
SXI_SPECIAL_20031028_163326_BB_G12_CS1_02D_JPG.ZIP
(62.5 MB zip archive of JPEG source images) |
|
This movie starts on October 31st, and highlights the final
six days of this active interval.
SXI_SPECIAL_20031031_000222_BB_G12_CS1_06D.MPG
(11.4 MB MPEG-1, 21 seconds)
SXI_SPECIAL_20031031_000222_BB_G12_CS1_06D.MP2
(13.8 MB MPEG-1, 21 seconds)
SXI_SPECIAL_20031031_000222_BB_G12_CS1_06D_JPG.ZIP
(50.5 MB zip archive of JPEG source images.) |
|
|
Carrington Rotation #2006
|
|
Carrington Rotation #2003 & 2004
|
|
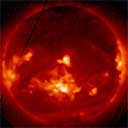
Flaring "sigmoid" region, large coronal hole, eruptive
prominence, etc.
|
|
This is similar to the movie above, but focuses on
the disk passage of the flaring "sigmoid" region.
|
|
Movie made during post launch testing, prior to light
leak problem.
|
|
Coronal
Hole Movie - Two Solar Rotations (~54 days).
|
This movie was created from images taken with SXI in the
OPEN (unfiltered) configuration. The images were deconvoluted,
as described in the example above. The sequence spans approximately
two solar rotations -- 2001-10-19 00:03:44 to 2001-12-05 22:13:09.
Coronal holes appear dark.
This movie was produced by Dr. Steven Hill, the SXI project
manager at NOAA's Space Weather Prediction Center.
View
the movie.
(3.6 MB MPEG, 15 seconds) |
|
|
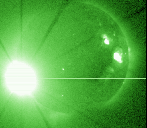
Coronal Mass Ejections
Movie w/Coronagraph- One Day.
|
This sequence spans one day (2001-10-22). The SXI images
are displayed in tandem with the coronagraph images from the LASCO C2 instrument
onboard SOHO. The movie shows the relationship between X-ray
flares viewed by SXI and the resultant effect on the extended
corona.
This movie was produced by Dr. Steven Hill, the SXI project
manager at NOAA's Space Weather Prediction Center.
View
the movie.
(3.5 MB MPEG, 6 seconds)
Begin Max End Region Lat CMD X-class
 0022 0040 0048 9658 N17 W57 M1.0
 0344 0359 0423 9669 N14 W12 C6.8
 1136 1141 1145 9672 S18 E19 C5.6
 1205 1217 1230 9669 N11 W19 C7.5
 1427 1508 1531 9672 S21 E18 M6.7
 1744 1759 1814 9672 S18 E16 X1.2
2057 2106 2114 C7.9 |
|
|
SXI vs. SXT Comparison,
Large Scale View of Small Flare - Four Hours.
|
This sequence spans approximately four hours (2001-11-21
13:18 to 2001-11-21 16:53). The SXI images are displayed in
tandem with images from the SXT instrument onboard Yohkoh. The movie shows a zoomed view of
region 9704 as it produces a small (C4.7) flare.
This movie was produced by Dr. Steven Hill, the SXI project
manager at NOAA's Space Weather Prediction Center.
View
the movie.
(.2 MB MPEG, 2 seconds)
Begin Max End Region Lat CMD X-class
1207 1458 1650 9704 S14 W19 C4.7 |
|
|
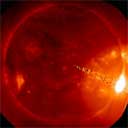
Image enhancement using deconvolution
and multi-image composite.
 |
To address the wide dynamic range of features on the sun,
it is sometimes necessary to combine two images, one short
exposure and one long exposure, into what is known as a composite
image. The overexposed regions from the long exposure are
replaced with those properly exposed from the shorter exposure.
In addition, all optical instruments have a natural 'blurring'
or point-spread function. A composite image is particularly
amenable to removal of the point-spread function of the instrument.
This is done by a mathematical process called deconvolution.
This prototype was produced by NOAA's Space Weather Prediction Center,
and may become a standard SXI data product.
View a "before and after"
pair of images. (2001-19-19 23:11:46) |
|
|
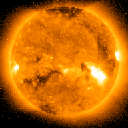
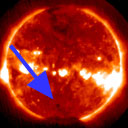
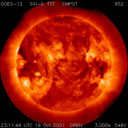
September 7, 2001 -- First released
SXI image.
 |
This X-ray image of the Sun was taken by the SXI instrument
onboard GOES-12 on September 7, 2001 at 21:04:25 Universal
Time.
|
|
|


