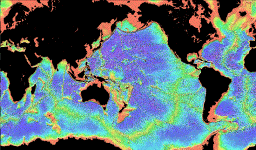
Global Seafloor Topography
|
| Preview .gif Image |
A color poster has been prepared displaying measured and estimated seafloor topography. The poster is printed in a Mercator projection from data gridded uniformly at intervals equivalent to 2 minutes longitude at the equator. This new estimate of seafloor topography was obtained from shipboard depth soundings combined with gravity data derived from satellite altimetry to produce a gridded representation of seafloor topography for all ice-free ocean areas within +/-72 degrees latitude. The depth data were obtained by screening 6905 surveys from the NGDC (now NCEI) (Marine Trackline Geophysics CD-ROM version 3.2), the Scripps Institution of Oceanography and Lamont-Doherty Earth Observatory databanks, and other data, using quality control procedures based on those of Smith [J. Geophys. Res. 98, 9591-9603, 1993]. The satellite gravity field combines all data from the ERS-1 and GEOSAT satellites including the data declassified in 1995; it has an RMS accuracy of 3-5 mGal and a resolution of 20-30 km wavelength [Sandwell and Smith, J.Geophys. Res. 102, 10,039-10,054, 1997].
The method [Smith and Sandwell, Science 277, 1956-1962, 1997] is an improvement on one developed earlier for GEOSAT data south of 30 degrees S [Smith and Sandwell, J. Geophys. Res. 99, 21,803-21,824, 1994]. The new topographic map is visually quite different from the satellite gravity field. Isostatically compensated topography stands out in full relief, and edges are sharper due to the inclusion of ship data and the downward-continuation of the gravity field. Dramatic scarps are seen such as at the eastern edge of Manihiki Plateau. The topography map shows seafloor structure while the gravity map includes sub-seafloor anomalies. In addition to this poster, digital data will be available at a later date on CD-ROM. The disc will contain the 2x2 minute digital data for the Measured & Estimated Seafloor Topography as binary raster files and formatted for use in GMT (Generic Mapping Tool). The GEOSAT gridded 2-minute gravity data will also be on the CD-ROM.
Measured & Estimated Seafloor Topography Poster, WDC GMG, Boulder RP-1
A color poster approximately 34" X 53"
Product number G01333-POS-A0001

