Great Lakes Data Rescue Project - Lake Ontario Bathymetry
ARC/INFO® 7.2.1 was used to generate the vector files for the contours and coastline, and the files are available on this CD-ROM. Uncompressed interchange files (dat/contour.e00 and dat/coast.e00) were generated with the export command. Shape files (dat/contour.shp, dat/contour.shx, dat/contour.dbf, dat/coast.shp, dat/coast.shx, and dat/coast.dbf) were generated using the arcshape command. These data are also available as ASCII xyz and xy files in the "dat" directory as contour.xyz and coast.xy with each individual line segment separated by a ">". . The coastline data can also be found in the "gdas" directory as a part of the GEODAS coastline file nosconus.b00 (see GEODAS help on the CD-ROM for full explanation). The data source of the contours can be found in the 'source' field of the interchange and shape files and is also compiled in the data source map which contains a legend for the interchange and shape files.
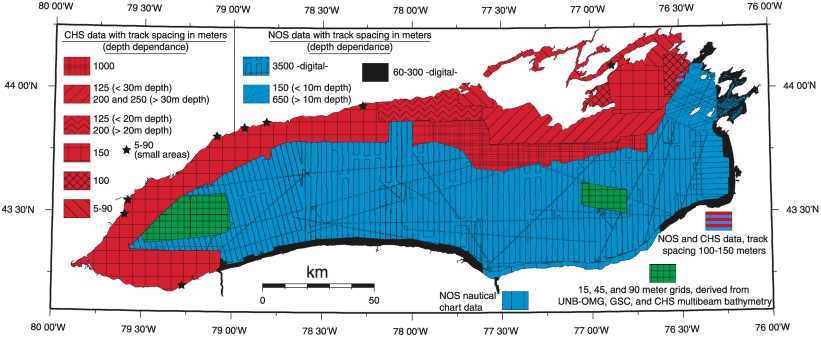
As mentioned above the data sources for all the contours can be found on this CD-ROM. A separate data density image is shown below. These maps were primarily generated for those who do not have a way to access the ARC/INFO® files described above. The entire historic hydrographic sounding data base from the U.S. and Canada, originally collected for nautical charting purposes, was used to generate a more complete and accurate representation of Lake Ontario bathymetry than previously done. The U.S. data are primarily from the U.S. National Ocean Survey (NOS) Hydrographic Survey Data, U.S. Coastal Waters CD-ROM Set (Version 4.0, Data Announcement 98-MGG-03) referred to as the NOS -digital- data in the image below. This and other bathymetric sounding data collected by the NOS's Coast Survey and the U. S. Army Corps of Engineers were employed to construct bathymetric contours at 1 meter intervals from 1-10 meters depth and 2 meter intervals at depths greater than 10 meters. Also added in the U.S waters were the 15, 125, 175, and 225 meter contours to complete these contours through the entire lake. Bathymetric sounding data collected by the Canadian Hydrographic Service (CHS) were employed to construct bathymetric contours at 1 meter intervals in most cases. Digitization of the bathymetric contours, merging of the bathymetric contour data sets, poster construction, and preparation of a CD-ROM, were accomplished at the National Geophysical Data Center (NGDC). Multibeam bathymetric data collected by the University of New Brunswick's Ocean Mapping Group (UNB-OMG), with support of the Geological Survey of Canada (GSC) and the CHS, were kindly made available in gridded form. In the two areas where multibeam bathymetric data were available, no other bathymetric data were used in the compilations. In some areas all available Canadian and U. S. bathymetric sounding data, collected at different times on different survey expeditions, were used to derive the contours. Neither vertical nor horizontal datum's were adjusted, however they were considered in edge matching the various sets of data used for this project. It could be useful to note that the IGLD55 and IGLD85 vary by less than 3 tenths of a meter which for the purposes of this project is insignificant.
A Lake Ontario coastline file was generated as part of this project. Data sources for this coastline include: digital data received from the Canadian Hydrographic Service (CHS), CHS smooth sheets that NGDC digitized (listed in the data source map's legend), the U.S. NOAA/Great Lakes Environmental Research Lab's (GLERL) Medium Resolution Vector Shoreline of the Great Lakes (see Lee, D. H., C. Morse, and D. Bandhu, 1998, Great Lakes and St. Lawrence River Medium Resolution Vector Shoreline Data, NOAA Technical Memorandum NOAA ERL GLERL-104), and the U.S. NOAA/National Ocean Service's (NOS) Medium Resolution Vector Shoreline of U.S. waters. The following list is for the source field of the interchange and shape files in the "dat" directory.
As seen in the image below, the density of data varies greatly from one region to another. The areas with 650 meters track spacing or more contain low data density, and areas with track spacing of 300 meters or less contain high data density. The multibeam bathymetric data are of very high data density, and the NOS nautical chart data have very low data density. More data in the present low data density areas would not only better verify existing contours but also show more details of bottom topography (as illustrated on the lake images if high data density and low data density areas are compared).