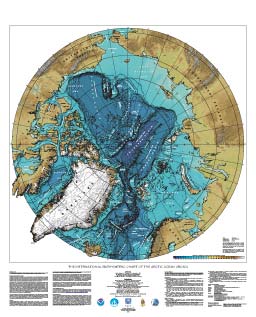
INTERNATIONAL BATHYMETRIC CHART OF THE ARCTIC OCEAN (IBCAO)
IBCAO RP-2, 2004 Poster of Arctic Bathymetry
Please use the online store for all orders within the USA.
This new IBCAO RP-2, 2004 Poster is a polar stereographic view of the Arctic Ocean displaying bathymetric contours north of 64 degrees north at a scale of 1:6,000,000. The poster size is 42 x 52 inches. The goal of IBCAO is to develop a digital data base that contains all available bathymetric data north of 64 degrees North, for use by mapmakers, researchers, and others whose work requires a detailed and acurate knowledge of the depth and the shape of the Arctic seabed. Initiated in 1997, this undertaking has so far engaged the volunteer efforts of investigators who are affiliated with eleven institutions in eight countries: Canada, Denmark, Germany, Iceland, Norway, Russia, Sweden, and the USA. The activity has also been endorsed and/or supported financially by the Intergovernmental Oceanographic Commission (IOC), the International Arctic Science Committee (IASC), the International Hydrographic Organization (IHO), the US Office of Naval Research (ONR), and the US National Geophysical Data Center (NGDC; now the National Centers for Environmental Information (NCEI)) (now National Centers for Environmental Information (NCEI)). In addition to this new poster, IBCAO RP-2, 2004, version 1.0 of the IBCAO Grid is available for download in multiple format from the IBCAO web site, along with bathymetric contours in digital vector form and an updated version of the Map that is suitable for plotting. The information used in the construction of this database and map consist of: historic and recent under-ice soundings collected by submarines of the United States and the United Kingdom; historic and recent observations collected by icebreakers and drifting ice stations; and information portrayed in published navigation and compilation charts. The locations of these data sets are shown in separate source distribution maps, while data contributors and relevant references are listed in this legend under "Data Contributions". Although extensive, in some areas the database of digital trackline and spot observations contained critical gaps that had to be augmented with information that was only available on paper maps and charts. In the central Arctic Ocean, original observations were augmented with contour information derived from a map published by the Russian Federation Navy. Similarly, contours extracted from maps published by the Geological Society of America were used in Bering Strait and in the Barents and Kara Seas. On the continental shelf adjacent to Siberia, soundings were extracted from a suite of navigational charts published by the Russian Federation Navy, and used to develop contours. Bathymetry in the Gulf of Bothnia was derived from a compilation by Seifert and Kayser. Contours were extracted from the GEBCO Digital Atlas (GDA) to supplement the database in the southern Norwegian-Greenland Seas, in Baffin Bay, and in some areas of the Canadian Arctic. Land relief was derived from the USGS GTOPO30 topographic model, with the exception of Greenland, where the model developed by the Danish National Survey and Cadastre (KMS) was used, and Alaska, where release 1.1 of the GLOBE topographic model was used. Coastline definition was provided by the World Vector Shoreline (WVS) in all areas except Greenland and northern Ellesmere Island, where an updated coastline was available from KMS. Original soundings were corrected for sound velocity using Carter's Tables, or CTD (Conductivity, Temperature and Depth) profiles where available. Subsequently, all data (digitized isobaths; land and marine relief grids; point, profile and swath observations; and vector shorelines) were imported into Intergraph's Geomedia Professional, with projection parameters set to polar stereographic on the WGS 84 ellipsoid, and with true scale at 75° N. Outliers, cross-track errors, and the fit between isobaths and original observation data were checked. Suspicious soundings were removed and, where contours showed major discrepancies with soundings, the contours were adjusted manually to agree with trackline data. After inspection all data sets were exported to an XYZ coordinate system for further manipulation with GMT (Generic Mapping Tools) public domain software. Initially, the data sets were preprocessed with the GMT block-median filter, after which they were gridded at a cell size of 2.5 x 2.5 km by fitting a surface of continuous curvature to all points with a tension parameter set to 0.35. The resulting grid was exported to Intergraph.s MGE Terrain Analyst (MTA) for detailed inspection, and for the identification of discrepancies that had to be addressed in the input data set. The data were then regridded and reinspected for residual discrepancies. This process was repeated until the results were judged to be satisfactory. The grid that was used for the construction of the map can be obtained in two forms: Cartesian with a cell size of 2.5 x 2.5 km at 75°N, and Geographic with a cell size of one minute of latitude by one minute of longitude. These grids, along with detailed descriptions of their formats and the techniques employed in their preparation, can be downloaded.
For additional information and data from IBCAO, please visit the IBCAO:
|
| All Bathy/Relief | Coastal DEMs | Fishing | Global | Lakes | Multibeam | NOS |
